Full Title: Year-on-year GDP Growth Rate of G7 Countries, China, Brazil, Russia, and India [Article No. 1.2.7]
日本語タイトル:G7各国,中国,ブラジル,ロシア,インドの前年比GDP成長率 [記事 No. 1.2.7]
Posted on August 12, 2026.
[Figures]
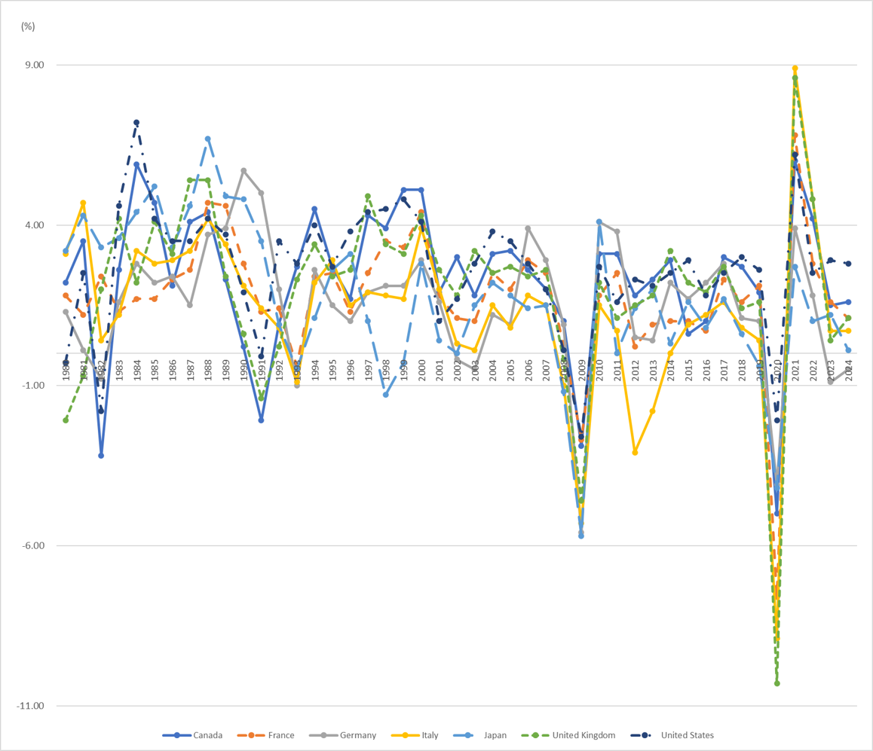
Figure Year-on-year GDP Growth Rate of G7 Countries, China, Brazil, Russia, and India
Figure G7各国,中国,ブラジル,ロシア,インドの前年比GDP成長率
Panel A G7 countries(1980-2024, %)
Panel A G7 各国(1980-2024, %)
Panel B China, Brazil, Russia, and India(1980-2024, %)
Panel B 中国,ブラジル,ロシア,インド(1980-2024, %)
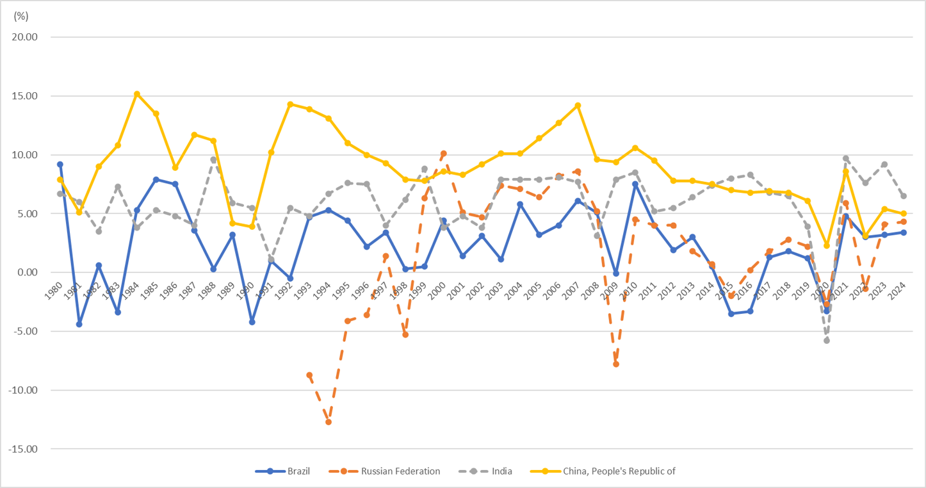
Source: By Yoshida using IMF (2025) “World Economic Outlook, October 2025” data from https://www.imf.org/en/data, accessed on Mar. 17, 2026.)
[Facts]
- これらの図から,2000年代末の世界金融危機時,2020年代初めの新型コロナ・ショック時には,世界的に経済成長が大きく落ち込んだことが分かる.
- G7各国よりもBRICSを構成する中国,ブラジル,ロシア,インド各国の方がGDPの前年比成長率は相対的に大きい.
- 2010年代前半までは,中国の前年比GDP成長率が他国を大きく凌いでいた.しかし,2020年代になると,インドの成長率が中国の成長率を上回るようになった.
- These Figures indicate that global economic growth declined significantly during the global financial crisis of the late 2000s and during the COVID-19 shock of the early 2020s.
- The year-on-year GDP growth rates of China, Brazil, Russia, and India, the members of BRICS, are relatively higher than those of the G7 countries.
- Until the early 2010s, China’s year-on-year GDP growth rate significantly outpaced that of other countries. However, in the 2020s, India’s growth rate began to exceed China’s.
[Discussion]
- これらの図は,G7各国やBRICSに属する中国,ブラジル,ロシア,インド各国を対象として経済成長の趨勢を説明している.これらの図が示している事実はWorld Bank Group(2025) Global Economic Prospects,Figure 3.1.Aが説明している以下の事実と符合している.つまり,過去25年間で,中国,インド,ブラジルを中心とした開発途上国(途上国)のウェイトが世界GDPの半分近くを占めるまでに大きくなった.
- These figures describe the trends in economic growth for the G7 countries and the BRICS nations—China, Brazil, Russia, and India. The facts presented in these figures are consistent with the following findings described in World Bank Group (2025), Global Economic Prospects, Figure 3.1.A. Specifically, over the past 25 years, the share of developing countries—led by China, India, and Brazil—has grown to account for nearly half of global GDP.
[From World Bank Group(2025) “Global Economic Prospects” Figure 3.1.A]
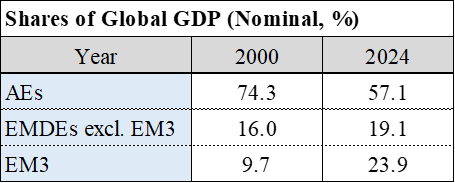
Notes: (1) AEs, EMDEs, and EM3 respectively denote advanced economies, emerging market and developing economies, and the total of China, India, and Brazil. (2) GDP is measured in average 2010-19 prices and market exchange rates. (3) EMDEs consists of 154 countries and AEs 38 countries.
注:(1)AEs, EMDEs, と EM3 は,それぞれ 先進国,途上国,と中国・インド・ブラジルを表す.(2) GDP は2010-19年の平均価格と市場為替レートで測られている.(3) 途上国カテゴリーには154か国が属し,先進国カテゴリーには38か国が属している.
Source: The above table prepared by the author based on the data of World Bank Group (2025) “Global Economic Prospects” https://www.worldbank.org/ja/news/press-release/2025/01/16/gep-january-2025-press-release, accessed on August. 12, 2026.)
コメント