Full Title: How do Developed Countries Use their Added Value (Income)? (OECD Countries, 2023) [Article No. 1.5.3]
日本語タイトル:先進国は付加価値(所得)をどのように使用しているのか?(OECD各国,2023)[記事 No. 1.5.3]
Posted on August 25, 2026.
[Figure & Table]
Figure How to Use Added Value (Income) in Developed Countries 2(OECD Countries, 2023)
Figure 先進国における付加価値(所得)の使い方2(OECD各国,2023)
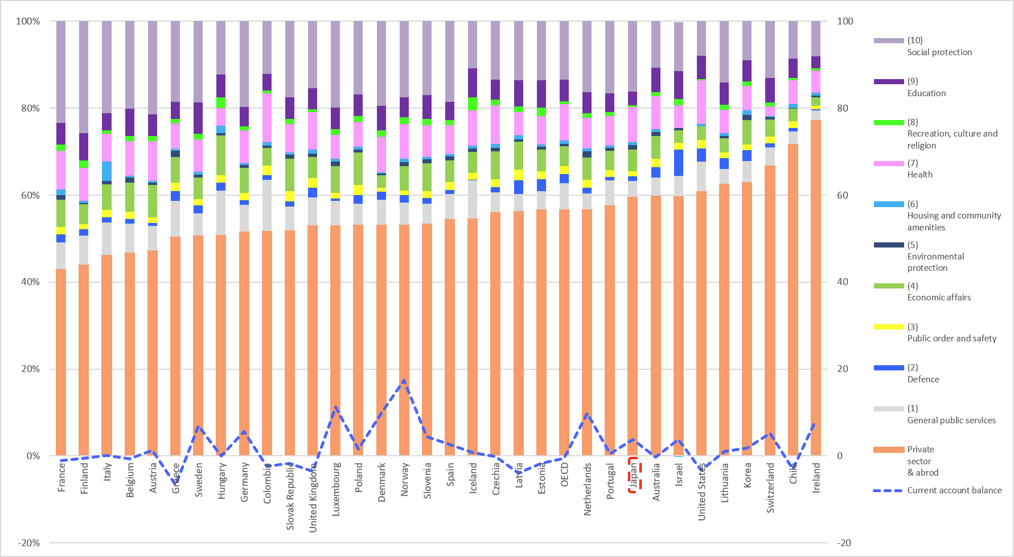
Source: By Yoshida using OECD (2025) “Government at a Glance 2025” data, URL: https://www.oecd.org/en/publications/government-at-a-glance-2025_0efd0bcd-en.html, accessed on Mar. 16, 2026, & IMF data, regarding current account balance, URL: https://www.imf.org/en/publications/weo/weo-database/2025/april/select-country-group, accessed on Mar. 16, 2026.
Table How to Use Added Value (Income) in Developed Countries 2 (OECD Countries, 2023)
Table 先進国における付加価値(所得)の使い方2(OECD各国,2023)
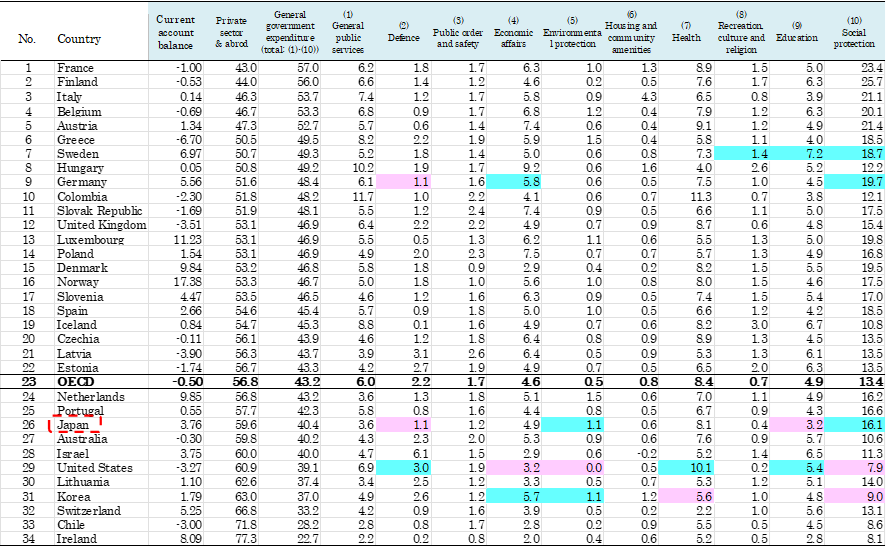
Source: By Yoshida using OECD (2025) “Government at a Glance 2025” data, URL: https://www.oecd.org/en/publications/government-at-a-glance-2025_0efd0bcd-en.html, accessed on Mar. 16, 2026, & IMF data, regarding current account balance, URL: https://www.imf.org/en/publications/weo/weo-database/2025/april/select-country-group, accessed on Mar. 16, 2026.
[Facts]
- 東アジアの国である韓国と日本は(総付加価値に対する)公的セクターにおける付加価値の利用割合が小さい.アメリカは公的セクターにおける付加価値の利用割合が日本よりも小さい.
- 公的セクターにおける付加価値の利用割合と経常収支比率の間に強い相関は見られない(これら指標間の相関係数は-0.118である).なお,経常収支の基本については[記事 No. 1.2.1] [記事 No. 1.2.2]を参照されたい.
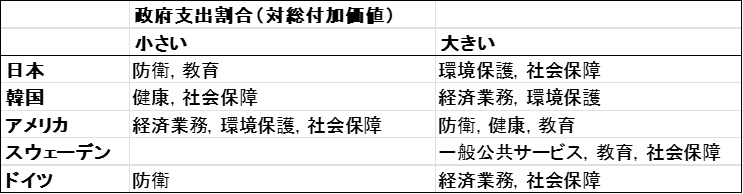
- 上記Tableにおいて,日本及び日本との比較に有益な各国における特徴的な政府支出(歳出)カテゴリーにマーキングを実施した.OECD(平均)値との比較に基づき当該各国における特徴的な政府支出をまとめると以下の表の通りである.
- South Korea and Japan, both East Asian countries, have a low ratio of added value utilized in the public sector to the total added value. The United States has a lower ratio of added value utilized in the public sector than Japan.
- There is no strong correlation between the ratio of added value utilized in the public sector and the current account balance ratio (the correlation coefficient between these ratios is -0.130).
- In Table above, I have highlighted the distinctive government expenditure categories in Japan and in other countries that are useful for comparison with Japan. The following table summarizes the distinctive government expenditures in these countries based on a comparison with the OECD (average) values.

[Discussion]
- 著者の知見からは,多くの日本人は「日本は大きな政府の国だ」と思っていると推量する.しかし,事実はこの認識に反して,日本は先進国中相対的に小さな政府の国の一つである.また,同じ東アジアの国である韓国についても同じ判断を下すことができる.ここで説明した内容は[記事 No. 1.6.1] [記事 No. 1.6.2] [記事 No. 1.5.2] の内容と同様である.
- 日本国内では,日本の教育に対する政府支出の少なさがしばしば指摘される.しかし,当該指摘は事実であるものの,日本はそもそも政府総支出の規模自体が小さいことに留意する必要がある.また,2023年時点においても,2015年時点と同様に日本の防衛に対する政府支出規模は小さいこと,一方,社会保障支出規模は大きいことが分かる(参照 [記事 No. 1.5.2]).
- 韓国は経済分野への政府支出規模が大きいこと,アメリカは防衛や教育への政府支出規模が大きい一方,経済分野への政府支出規模や社会保障支出規模は小さいこと,北欧の国であるスウェーデンは国民の日常生活に関係する分野への政府支出規模が大きいことが分かる(参照 [記事 No. 1.5.2]).
- 防衛費についての特記事項.アメリカは2025年以降NATOや日本に対して防衛費の増加を要求している.(上記表には掲載していないが)OECD中EU所属各国の防衛費割合の平均値は「1.3%」でり,日本の値は「1.1%」である.一方,アメリカの値は「3.0%」,イスラエルの値は「6.1%」となっている.OECD全体での平均値「2.2%」を基準として観た場合,ことの是非はさておき,EU全体や日本は防衛費の規模は相対的に小さいがアメリカやイスラエルの規模は相対的に大きい.なお,この状況は2015年以降変わっていない(参照 [記事 No. 1.5.2]).
- Based on the author’s knowledge, it can be inferred that many Japanese people believe “Japan is a large-government country.” However, contrary to this perception, Japan is one of the relatively low government-size countries among developed countries. Furthermore, the same conclusion can be drawn regarding South Korea, another country in East Asia. The content explained here is consistent with that in [Article No. 1.6.1] [Article No. 1.6.2] [Article No. 1.5.2].
- In Japan, the low level of government spending on education is often pointed out. However, while this observation is true, it is important to note that the overall scale of government expenditure in Japan is fundamentally small. Furthermore, as of 2023 same as 2015, it is evident that government spending on defense in Japan was small, while spending on social security was large (see [Article No. 1.5.2]).
- It is evident that South Korea has a large scale of government spending in economic affairs; the United States has a large scale of government spending on defense and education, but a small scale of spending on economic affairs and social security; and Sweden, a Nordic country, has a large scale of government spending in areas related to citizens’ daily lives (see [Article No. 1.5.2]).
- Special notes on Defense spending. The United States has been demanding that NATO (North Atlantic Treaty Organization) and Japan must increase their defense spending since 2025. The average defense spending as a % of GDP among EU member countries within the OECD is “1.3%,” which is not shown in Table above, while Japan’s figure is “1.1%.” In contrast, the United States’ figure is “3.0%” and Israel’s is “6.1%.” When viewed the OECD average of “2.2%” as a benchmark, putting aside the pros and cons of this, the scale of defense spending in the EU as a whole and in Japan is relatively small, while that of the United States and Israel is relatively large. This situation has not changed since 2015 (see [Article No. 1.5.2]).
コメント