Full Title: Gini Coefficient of Wealth distribution by Country [Article No. 1.3.3]
日本語タイトル:資産分布に関するジニ係数(国別)[記事 No. 1.3.3]
Posted on August 3, 2026.
[Table]
Table 1 Gini Coefficient of Wealth distribution by Country (2000-2022)
Table 1 資産分布に関するジニ係数(国別)(2000-2022)
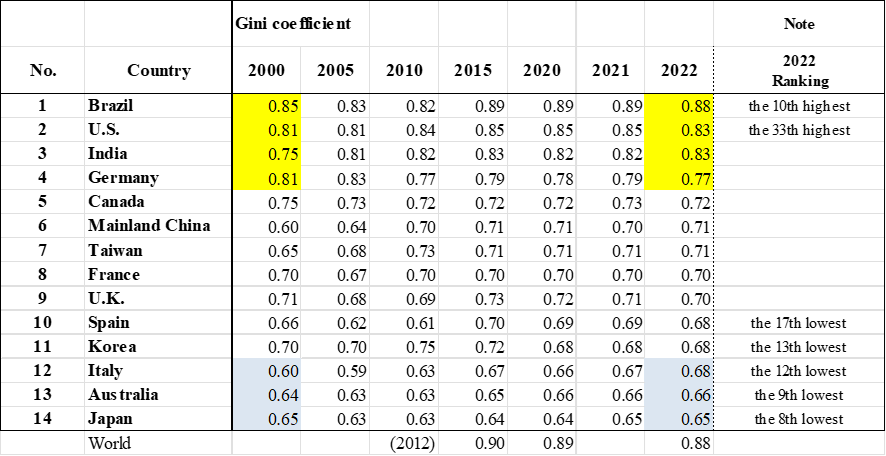
Note: Gini coefficient takes value between 0 and 1. If its value =0, perfect equality realizes. If its value = 1, perfect inequality realizes.
Source: By Yoshida using the following data. Credit Swisse AG (2023) “Global Wealth Report 2023,” Table 6, UBS (2012, 2021, 2023) “Global Wealth Databook 2012, 2021, and 2023,” Table 3-1, United Nations (2022, 2024) “World Population Prospects 2022 & 2024,” and IMF (2024) ” World Economic Outlook Database, April 2024.”
[Facts]
- 世界的に観ると,資産分布のジニ係数が相対的に高い国と低い国に分かれる.
- 日本は相対的にジニ係数が低い国の一つである.
- 2002年-2022年間で,総体的には,ジニ係数が少し高くなっている.
- 世界金融危機前後の2005年,2010年において,ジニ係数の最低値を記録している国が多い.
- From a global perspective, countries can be divided into those with relatively high Gini coefficients for wealth distribution and those with relatively low ones.
- Japan is one of the countries with a relatively low Gini coefficient.
- Overall, the Gini coefficient rose slightly between 2002 and 2022.
- In 2005 and 2010, around the time of the global financial crisis, many countries recorded their lowest Gini coefficients.
[Discussion]
- ジニ係数が相対的に高い国々ではその値が0.8を超えている.この状況は完全不平等(1.0)に迫っている状況と言うことができる.
- 相対的にジニ係数が低い国々でも,その値は0.6を超えている.この値は格差が非常に大きいと判断される閾値0.5を上回っている.
- In countries with a relatively high Gini coefficient, the value exceeds 0.8. This situation can be described as approaching perfect inequality (1.0).
- Even in countries with relatively low Gini coefficients, the values exceed 0.6. This figure exceeds the threshold of 0.5, which is considered to indicate very high inequality.
コメント