Full Title: Global Wealth Distribution [Article No. 1.3.1]
日本語タイトル:世界の資産分布状況 [記事 No. 1.3.1]
Posted on July 27, 2026.
[Table]
Table 1 Global Wealth Distribution by Wealth Category, 2012–2022
Table 1 世界の資産分布(資産階級毎), 2012–2022
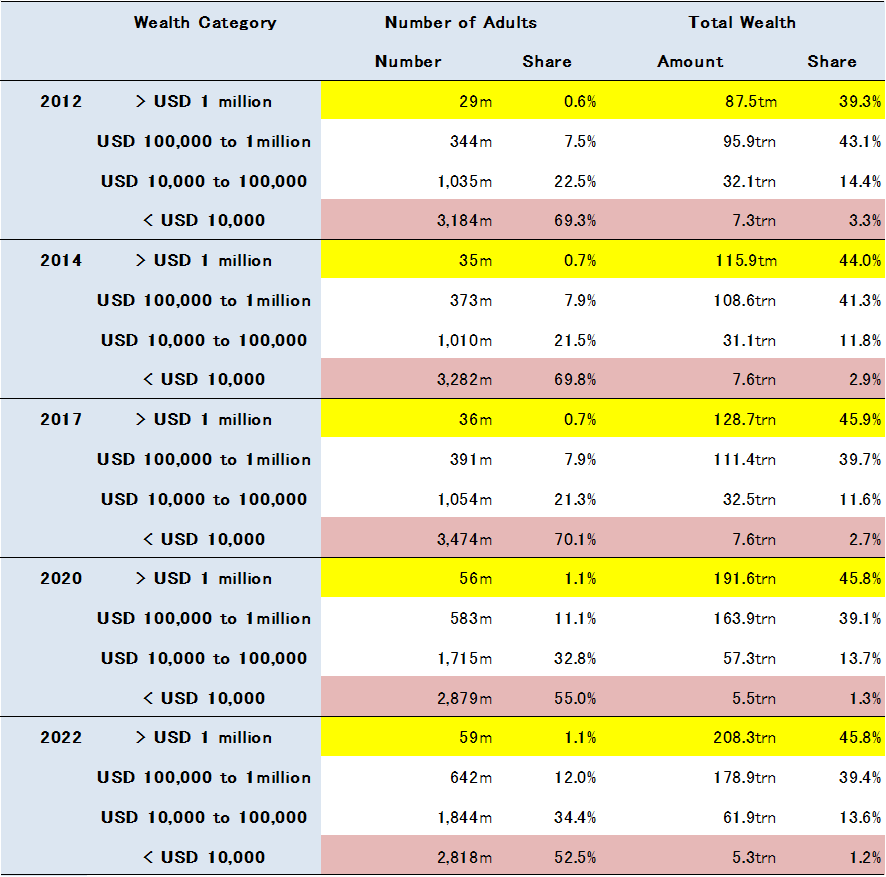
Source: Table prepared by the author based on Credit Suisse AG, Global Wealth Report (2012, 2014, 2017, 2021, and 2023 issues), Figure 1.
[Facts]
- 資産水準でトップカテゴリー(>USD 1 million)に属する人口シェアは2012-2022念の間で80%強増加.当該カテゴリーが占める資産シェアは約6.5%ポイント増加.
- 資産水準でセカンドカテゴリー(>USD 100,000 to 1 million)に属する人口シェアは2012-2022年の間で60%増加.当該カテゴリーが占める資産シェアは4%ポイント弱減少.
- 資産水準でサードカテゴリー(>USD 10,000 to 100,000)に属する人口シェアは2012-2022年の間で50%強増加.当該カテゴリーが占める資産シェアは1%ポイント弱減少.
- 資産水準でボトムカテゴリー(<USD 10,000)に属する人口シェアは2012-2022年の間で約25%減少.当該カテゴリーが占める資産シェアは約2%ポイント減少.
- The share of the population in the top wealth category (>USD 1 million) increased by more than 80% over 2012 – 2022. The share of total wealth held by this category increased by approximately 6.5 percentage points.
- The share of the population in the second wealth category (>USD 100,000 to 1 million) increased by 60% over 2012 – 2022. The share of total wealth held by this category decreased by just under 4 percentage points.
- The share of the population in the third wealth category (>USD 10,000 to 100,000) increased by just over 50% over 2012 – 2022. The share of total assets held by this category decreased by just under 1 percentage point.
- The share of the population in the lowest wealth category (<USD 10,000) decreased by approximately 25% over 2012 – 2022. The share of total wealth held by this category decreased by approximately 2 percentage points.
[Discussion]
- 1980年代末から2000年代における,世界における平均年収水準別成長率を図示した有名なグラフに「Elephant Curve*」がある。当該グラフが示す著名な特徴は次の3つである.(1) 平均年収水準のトップ1%に位置する人々の平均年収の期間成長率は極めて高い(60%超).(2) 平均年収水準の下位70%に位置する人々の平均年収の期間成長率も極めて高い(50%超).(3) 平均年収水準の上位10-20%に位置する人々の平均年収の期間成長率は極めて低い(10%未満).
- 上記1で示した状況は,今回示したGlobal Wealth Distribution (Table 1) を形成する重要な背景と考えられる.
- 更に,Global Wealth Distribution (Table 1)やElephant Curveが示す事実は,1980年代末以降発生した,先進各国における中間層の継続的な(相対的に見た場合の)経済的没落と考えられる.
- 上記3で説明した状況は,欧米各国や日本で現在生じている政治的分断の素地とも考えられる.
(*) Lakner, C. and B. Milanovic (2016) “Global Income Distribution: From the Fall of the Berlin Wall to the Great Recession,” The World Bank Economic Review, Vol. 30, No. 2, pp. 203-232.
- The “Elephant Curve*” is a well-known graph illustrating growth rates by average annual income level worldwide from the late 1980s through the 2000s. This graph exhibits the following three notable characteristics: (1) The growth rate over this period for the average annual income of those in the top 1% is extremely high (over 60%). (2) The growth rate over this period for the average annual income of people in the bottom 70% is also extremely high (over 50%). (3) The growth rate over this period for the average annual income of people in the top 10–20% is extremely low (less than 10%).
- The situation described in Item 1 provides an important backdrop to the Global Wealth Distribution (Table 1) shown in this article.
- Furthermore, the facts revealed by the Global Wealth Distribution (Table 1) and the Elephant Curve suggest a continuous (relative) economic decline of the middle class in developed countries since the late 1980s.
- The situation described in Item 3 can be seen as the foundation for the political divisions currently occurring in Western countries and Japan.
(*) Lakner, C. and B. Milanovic (2016) “Global Income Distribution: From the Fall of the Berlin Wall to the Great Recession,” The World Bank Economic Review, Vol. 30, No. 2, pp. 203-232.
コメント